



Oracle Data Guard Monitoring on Microsoft SCOM
How to Monitor Data Guard Broker, Synchronization, Fast-Start Failover and Observer Readiness

Data Guard is more than a primary and standby database
It’s a complex availability and disaster recovery solution built on interconnected databases, redo transport, synchronization, Broker configuration, and failover mechanisms, where issues in one area can quickly impact the entire protection strategy.
Traditional database monitoring alone often cannot answer the most important operational question: Is your Data Guard environment truly ready for failover when it matters?
This paper explores what should be monitored in an Oracle Data Guard environment, the role of Data Guard Broker and Observer, and how Microsoft System Center Operations Manager can provide a unified operational view.
Executive Summary
Oracle Data Guard is designed to provide high availability, data protection and disaster recovery for business-critical Oracle Database environments. By maintaining one or more standby databases and managing the transfer and application of redo data, Data Guard can help organizations reduce downtime and protect against database, infrastructure and site-level failures.
However, deploying Data Guard is only part of the availability strategy.
A Data Guard environment can appear healthy at first glance while important parts of its protection mechanism are degraded. The primary database may be available. The standby database may be online. Basic database monitoring may show no critical issue. Yet redo transport may be delayed, redo application may be falling behind, the Data Guard Broker configuration may report warnings, or a Fast-Start Failover Observer may no longer be operating as expected.
These conditions matter because database availability is not the same as failover readiness.
An organization therefore needs visibility not only into individual Oracle databases but into the health of the complete Data Guard configuration and the relationships between its components.
This includes continuous insight into:
- The overall Data Guard Broker configuration status
- The role and operational state of primary and standby databases
- Redo transport and apply lag
- Data Guard synchronization status
- Fast-Start Failover (FSFO) configuration and readiness
- Observer availability and status
- Role changes, switchovers and failovers
- Conditions that could compromise recovery objectives
- Trends that indicate a growing availability or data-protection risk
For organizations using Microsoft System Center Operations Manager (SCOM), this creates an opportunity to bring Oracle Data Guard monitoring into an established enterprise monitoring environment. Rather than treating the primary database, standby database, host and related services as isolated objects, SCOM can help operations teams understand the health of the environment as a whole, generate actionable alerts and integrate Oracle availability monitoring into existing operational processes.
This whitepaper examines the monitoring requirements of Oracle Data Guard environments, with particular focus on Oracle Data Guard Broker and Fast-Start Failover. It explains why transport and apply lag, Broker health and Observer status require dedicated attention and outlines how a specialized monitoring approach with Microsoft SCOM can help organizations move beyond simple availability monitoring.
The central principle is straightforward: A Data Guard environment should not be considered healthy simply because its databases are running. It should be considered healthy when the complete protection and failover mechanism is operating as intended.
High Availability Requires Continuous Visibility
Oracle databases frequently support some of the most critical workloads in an organization. Enterprise applications, financial systems, manufacturing platforms, customer-facing services and other core business processes can depend on their continuous availability.
For these environments, monitoring whether an Oracle instance is simply up or down is rarely sufficient.
A database can remain available while conditions are developing that affect its recoverability or its ability to meet defined recovery objectives. A standby database may remain online while falling progressively behind the primary. A Data Guard configuration may continue operating while reporting a warning condition. Fast-Start Failover may be configured, but the environment supporting automatic failover may not be in the expected operational state.
These are not merely database performance issues. They are availability and resilience issues.
Oracle Data Guard addresses these requirements by maintaining synchronized standby databases and supporting planned and unplanned role transitions. Oracle Data Guard Broker provides a management framework for the configuration, while Fast-Start Failover can automate failover under defined conditions. The Observer plays an important role in monitoring the Fast-Start Failover environment. Oracle’s current documentation also provides dedicated commands and status information for monitoring the Broker configuration, lag and Observer state.
But the existence of these capabilities does not remove the need for monitoring. Instead, they create additional components, states and relationships that need to be understood operationally.
Consider the following situation:
- The primary Oracle database is running.
- The standby database is running.
- Host monitoring reports no issue.
- The Oracle listener is available.
- CPU, memory and storage are within acceptable limits.
A traditional monitoring dashboard might therefore indicate that the environment is healthy.
At the same time:
- Redo transport to the standby may be delayed.
- Redo apply may be falling behind.
- The Broker may report a warning.
- The target standby may no longer satisfy the expected recovery requirements.
- The Observer may have lost connectivity or be unavailable.
The environment is operational — but its protection posture may be degraded.
This distinction is fundamental to effective Oracle Data Guard monitoring.
The purpose of monitoring is not simply to detect that a database has failed. In a mature availability strategy, monitoring should also identify conditions that could cause the recovery strategy to fail to meet expectations when it is eventually needed.
Understanding Oracle Data Guard as a Monitoring Environment
Effective monitoring begins with understanding what needs to be monitored.
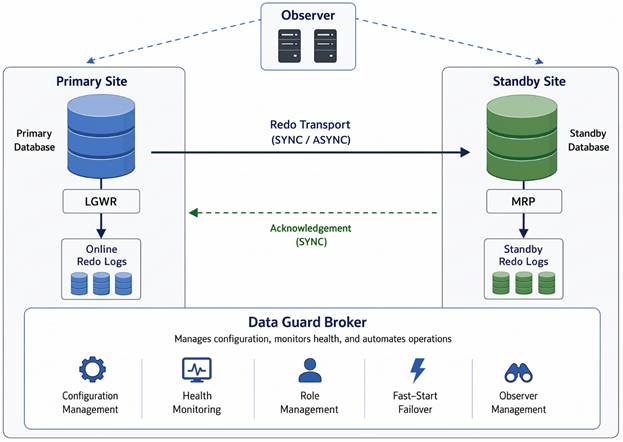
Figure 1: Oracle Data Guard Architecture Overview
A Data Guard deployment is not simply two independent Oracle databases. It is a configuration consisting of databases, data movement, synchronization processes, roles, management components and — where Fast-Start Failover is used — additional failover infrastructure.
At a conceptual level, a typical environment may contain:
- A primary database
- One or more standby databases
- Redo transport between primary and standby systems
- Redo apply on the standby
- An Oracle Data Guard Broker configuration
- A defined protection mode
- Fast-Start Failover configuration, where used
- One or more FSFO targets
- An Observer or multiple observers, depending on the configuration and Oracle Database version
Oracle Data Guard Broker provides commands to display configuration status and detailed lag information. Oracle documents transport lag as the amount of data, measured in time, that the standby has not received from the primary, while apply lag represents the elapsed difference associated with the last change applied on the standby.
From a monitoring perspective, these components should not be viewed independently.
The most important question is not only: Is the primary database running?
It is also: Is the complete Data Guard configuration healthy and capable of delivering the level of protection and recovery for which it was designed?
That question requires monitoring relationships.
For example:
- Primary database availability affects the ability of the production workload to continue.
- Standby database availability affects the availability of a potential failover target.
- Redo transport affects how current the standby is.
- Redo apply affects how much of the received data is actually available on the standby.
- Broker status provides information about the managed configuration and its members.
- Fast-Start Failover status affects whether automatic failover is configured and available under the defined conditions.
- Observer status affects an important part of the Fast-Start Failover environment.
Monitoring therefore needs to move from an object-based approach toward a configuration-aware approach.
Database Availability Is Not the Same as Failover Readiness
One of the most common monitoring mistakes is equating database availability with resilience. These are related, but they are not identical.
A database availability check answers a relatively simple question: Can the database currently be reached and used?
A Data Guard readiness check is broader: If the primary database or site becomes unavailable, is the environment currently in a state that can support the expected recovery process?
The difference is significant.
A healthy primary does not prove that the standby is current
The primary database can continue processing transactions while the standby falls behind.
Depending on the architecture and operating conditions, a growing transport or apply lag may increase the difference between the production database and the state represented by the standby.
Without monitoring this condition, an organization may not recognize the growing recovery exposure until a switchover or failover becomes necessary.
An available standby does not prove that recovery objectives can be met
A standby can be online but not sufficiently synchronized for the organization’s defined recovery objectives.
For example, a business may accept a small amount of lag for one workload while requiring significantly tighter synchronization for another. This means a single universal threshold is rarely appropriate.
Monitoring must reflect the importance and recovery requirements of the workload being protected.
An enabled configuration does not guarantee that every component is healthy
A Fast-Start Failover configuration can contain dependencies that require separate monitoring.
Oracle documents the Observer as continuously monitoring the Fast-Start Failover environment and describes commands and views that can be used to obtain Observer status. Oracle also notes that Observer and database connectivity states can affect whether the primary is considered observed or unobserved.
For operations teams, the practical conclusion is clear:
Configuration status should be monitored continuously rather than assumed from the original deployment state.
The Oracle Data Guard Monitoring Challenge
Traditional infrastructure monitoring is often very effective at detecting failures of individual components. It can answer questions such as:
- Is the server reachable?
- Is the Oracle service running?
- Is the database instance available?
- Is the listener responding?
- Is storage running out of capacity?
- Is CPU utilization excessive?
- Has a process stopped?
All of these checks remain important. However, they do not provide a complete picture of a Data Guard environment. The following comparison illustrates the difference.
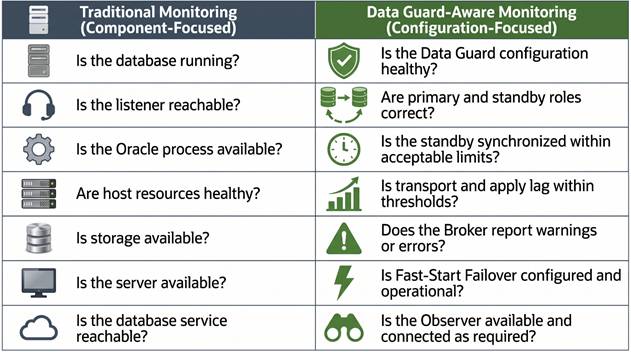
Figure 2: Component vs Configuration-based monitoring
The monitoring challenge is therefore one of context.
Individual objects may all report healthy states while the configuration that connects them is degraded.
A monitoring platform must therefore be capable of identifying not only component failures but also the health of the relationships and services built from those components.
This is particularly relevant in Microsoft SCOM.
SCOM’s monitoring model is designed around discovering objects, collecting health information and representing health states. A specialized management pack can extend that model with technology-specific knowledge, allowing Oracle-specific objects and conditions to be monitored within the same operational environment used for other infrastructure and applications.
For Data Guard, the goal should be to make the health of the availability configuration visible — not merely the health of its individual servers.
Monitoring Oracle Data Guard Broker
Oracle Data Guard Broker is a central management component for many Data Guard deployments and should therefore be a central monitoring consideration.
Oracle provides commands such as SHOW CONFIGURATION, SHOW CONFIGURATION VERBOSE, SHOW DATABASE, SHOW CONFIGURATION LAG VERBOSE and validation capabilities to inspect a Broker-managed environment. Current Oracle documentation includes examples showing configuration status, database member roles, Fast-Start Failover information and detailed transport and apply lag.
Monitor the overall configuration status
The overall Broker configuration status provides an important first-level indicator.
Monitoring should identify when the configuration is no longer reporting the expected healthy status and distinguish between normal operational states, warnings and error conditions where possible.
The purpose is not simply to reproduce command-line output in a monitoring console.
The purpose is to transform relevant state changes into operational visibility.
For example, monitoring should help answer:
- Has the configuration entered a warning state?
- Is a configuration member reporting an issue?
- Has the intended state of a database changed?
- Is a planned maintenance or role transition occurring?
- Does the condition require immediate action or investigation?
This distinction matters because not every non-default state has the same operational significance.
A planned maintenance operation should not necessarily create the same escalation as an unexpected degradation.
Monitor database member status and roles
Every member of a Data Guard configuration has an intended role and state.
Monitoring should make it easy to identify:
- Which database is currently primary
- Which databases are acting as standbys
- Whether expected role changes have occurred
- Whether the intended state of a database matches the actual operational state
- Whether a database member has entered a warning or error condition
This becomes particularly important following switchovers and failovers.
A monitoring configuration should not continue to interpret the environment according to yesterday’s database roles. After a role transition, the monitoring model needs to represent the new primary and standby relationships accurately.
Monitor warnings before they become outages
A major value of Broker-aware monitoring is the ability to identify degradation before a complete database outage occurs.
Not every operational problem results in an immediate failure.
The most valuable alerts are often those that identify:
- Synchronization is falling behind
- A configuration is no longer in the expected state
- A member has reported a warning
- A failover-related condition has changed
- An Observer-related condition requires attention
This is the difference between reactive monitoring and preventive operational visibility.
Transport Lag:
Monitoring the Data That Has Not Yet Arrived
Transport lag is one of the most important Data Guard metrics.
Oracle describes transport lag as the amount of data, measured in time, that the standby has not yet received from the primary. Oracle’s Broker documentation provides commands for displaying this information at database and configuration level.
From a business perspective, transport lag answers an important question: How far behind is the standby in receiving changes from production?
A growing transport lag can indicate issues such as:
- Network constraints
- Connectivity interruptions
- Resource limitations
- Increased workload
- Data transport bottlenecks
- Configuration-related problems
The exact cause requires investigation. Monitoring should therefore focus first on detecting meaningful deviation from the expected baseline.
Zero is not always the only acceptable value
The appropriate transport lag depends on the business and technical requirements of the environment.
A workload with a strict recovery point objective may require a very small lag. Another workload may tolerate a larger lag under normal operating conditions. The monitoring threshold should therefore not be selected arbitrarily.
Instead, it should be aligned with:
- Recovery Point Objective (RPO)
- Business criticality
- Protection mode
- Network architecture
- Workload patterns
- Planned maintenance and batch-processing windows
This is where monitoring flexibility becomes essential.
A threshold that is appropriate for one Oracle environment may create unnecessary alerts in another. Conversely, a generic threshold may allow unacceptable lag to develop unnoticed in a critical environment.
Monitor duration as well as value
A temporary lag spike is not necessarily equivalent to sustained degradation.
For this reason, monitoring strategies should consider:
- Current lag
- How long the lag has exceeded a threshold
- Whether the lag is increasing
- Whether the standby is recovering
- Historical trends
A useful operational distinction can be made between:
- Short-lived deviation
Potentially caused by a temporary workload spike or network event. - Persistent degradation
Indicates that the environment is not returning to its expected synchronized state.
Monitoring should support operations teams in recognizing this difference.
Apply Lag:
Monitoring the Data That Has Not Yet Been Applied
Transport and apply lag are related but represent different operational conditions.
Oracle defines apply lag in terms of the elapsed difference associated with the most recent change applied on the standby compared with when that change was first visible on the primary.
This distinction is important.
A standby may successfully receive redo while still being unable to apply it at the required rate. In such a situation, monitoring transport alone can provide an incomplete picture. The redo is arriving — but the standby is still falling behind in terms of applied data.
Why apply lag requires separate monitoring
Possible contributing factors can include:
- Insufficient standby resources
- High redo generation rates
- Apply performance limitations
- I/O constraints
- Configuration issues
- Operational conditions affecting apply services
The exact root cause will depend on the environment.
From a monitoring perspective, the important point is that successful data transport does not necessarily prove successful synchronization. Both stages need visibility.
A growing apply lag is an operational warning
If apply lag grows consistently, the organization should understand why.
The consequences may include a standby that is progressively less current and an increasing gap between the production state and the available recovery state.
Monitoring should therefore identify:
- Threshold violations
- Persistent lag
- Rapid increases
- Recovery toward normal levels
- Differences between expected and actual synchronization behavior
A well-designed SCOM monitoring implementation can convert these technical conditions into health states and actionable alerts rather than requiring administrators to manually review command output.
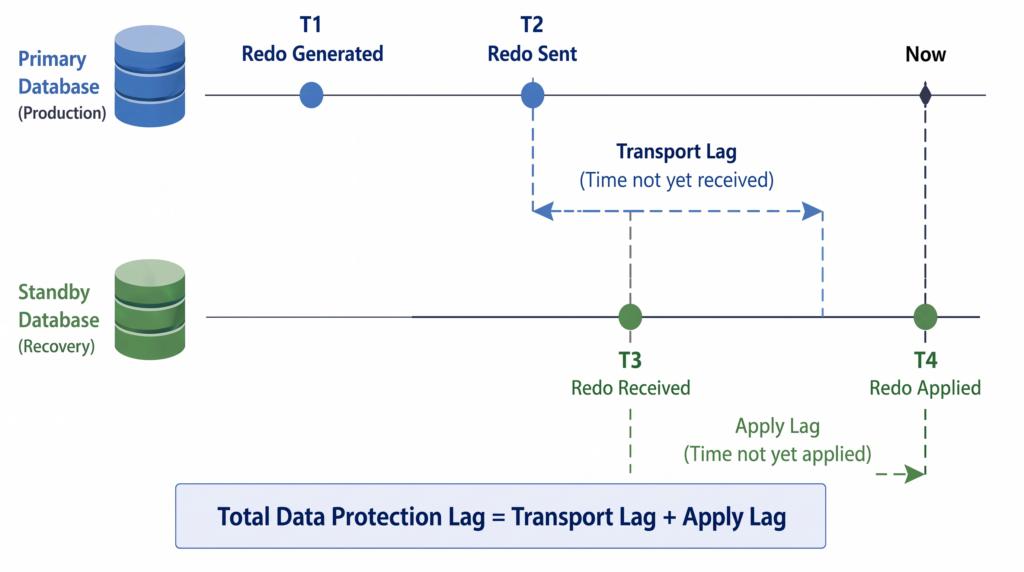
Figure 3: Transport vs Apply Lag
Monitoring Synchronization as a Business Requirement
Transport and apply lag are technical metrics, but their importance is ultimately determined by business requirements. For a critical application, the question may be:
- How much data can the business afford to lose?
- For another workload, the question may instead be:
- How quickly must the service be recovered?
These requirements are typically expressed through recovery objectives. Monitoring thresholds should support these objectives.
Align monitoring with recovery requirements
Consider three example environments.
Tier 1 financial workload
The organization requires minimal data exposure.
Monitoring may use very strict thresholds and rapid escalation when synchronization degrades.
Business-critical enterprise application
Some temporary lag may be acceptable, particularly during defined processing periods.
Monitoring may distinguish between short spikes and sustained degradation.
Non-critical reporting environment
A larger synchronization delay may be operationally acceptable.
Monitoring should still detect unexpected failures but may use less aggressive lag thresholds.
The key principle is:
Not every Data Guard configuration should be monitored according to the same definition of acceptable lag.
SCOM overrides are particularly useful in environments where monitoring requirements vary between systems.
Rather than changing the underlying monitoring logic for every database, administrators can adapt thresholds and behavior to individual workloads or defined groups where the monitoring design supports this approach.
Fast-Start Failover:
Monitoring Automatic Recovery Readiness
Fast-Start Failover is intended to automate failover to a designated standby under defined conditions.
Oracle documents Fast-Start Failover as a Broker capability and describes configuration properties including the failover threshold, lag limits and the type of lag used for Fast-Start Failover decisions. Oracle also documents that the selected configuration and protection mode affect the conditions under which automatic failover can occur.
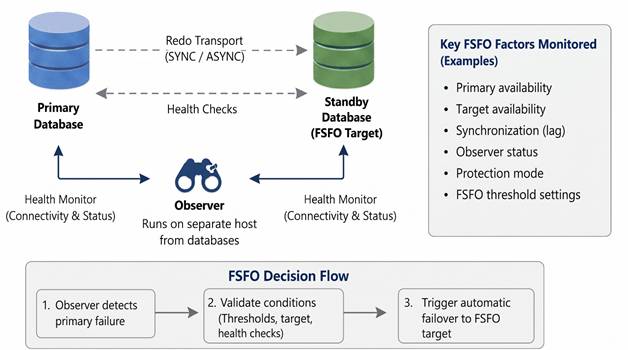
Figure: Fast Failover Components
For monitoring, the important message is: Fast-Start Failover should not be treated as a static checkbox that is configured once and then forgotten. Its operational readiness should be monitored.
Monitor whether FSFO is enabled
A basic monitoring requirement is visibility into whether Fast-Start Failover is enabled or disabled.
Unexpected changes should be visible because they may change the organization’s ability to perform automatic failover. However, enabled status alone is not enough.
Monitor the active and potential failover targets
Where the configuration uses defined Fast-Start Failover targets, operations teams need visibility into whether the expected target remains available and valid.
The environment may contain more than one potential target depending on the configuration.
A monitoring strategy should therefore identify the relationship between:
- The current primary
- The active target
- Potential failover targets
- Their health and synchronization state
The objective is to avoid discovering during an emergency that the expected target was no longer capable of meeting the conditions for failover.
Monitor lag in the context of FSFO
Oracle documents FastStartFailoverLagLimit and related properties as part of Fast-Start Failover configuration, including the ability to define whether apply or transport lag is used for the configured data-loss threshold.
This makes synchronization monitoring directly relevant to automatic failover readiness.
An organization should understand not only its current lag but also how that lag relates to the configured failover policy. This is an important distinction:
- Generic monitoring question: Is apply lag above 60 seconds?
- Availability question: Is the current synchronization state still consistent with the organization’s configured recovery and Fast-Start Failover expectations?
The second question provides significantly more operational context.
The Observer:
A Critical Component That Should Not Be Invisible
The Fast-Start Failover Observer deserves dedicated monitoring attention.
Oracle describes the Observer as a process that monitors the Fast-Start Failover environment and typically runs on a system separate from the primary and standby database systems. Current Oracle documentation provides commands and views for checking Observer status and documents multiple Observer configurations for high availability.
This creates an important monitoring requirement.
The Observer may not be running on the same host as the primary or standby database. As a result, database monitoring alone may not detect problems affecting the Observer.
Why Observer monitoring matters
Consider the following situation:
- Primary database: healthy
- Standby database: healthy
- Data Guard Broker: accessible
- Synchronization: within limits
- Observer: unavailable
A conventional database monitoring system may still show the core database infrastructure as healthy. However, the automatic failover environment may no longer have the expected operational characteristics.
The issue may therefore remain undiscovered until the organization relies on Fast-Start Failover during a real incident.
This is exactly the type of monitoring gap that should be eliminated.
What should be monitored?
Depending on the Oracle version and configuration, a monitoring design should provide visibility into relevant Observer conditions, including:
- Whether an Observer is registered and operating as expected
- Observer status
- Observer host information where available
- Connectivity-related status
- Changes affecting the observed state of the configuration
- Loss of the expected Observer relationship
Oracle specifically documents using SHOW OBSERVER, SHOW CONFIGURATION VERBOSE and the V$FS_FAILOVER_OBSERVERS view to obtain Observer-related status information in current releases.
The implementation should use the most appropriate supported method for the Oracle versions being monitored.
Monitor the Observer independently
A critical design principle is: The Observer should be monitored as an availability component in its own right.
If it runs on a dedicated system, the host and process environment should also be monitored appropriately.
Potential monitoring layers include:
- Host availability
- Required Oracle client/runtime availability
- Observer process or service state where applicable
- Oracle-reported Observer status
- Connectivity and observed-state conditions
This layered approach reduces the risk of assuming that the Observer is functioning simply because the server hosting it is online.
Observed and Unobserved Conditions
Oracle’s current documentation describes circumstances in which loss of connectivity between the Observer and the databases can result in an unobserved state, with the Broker health-check capability reporting the condition.
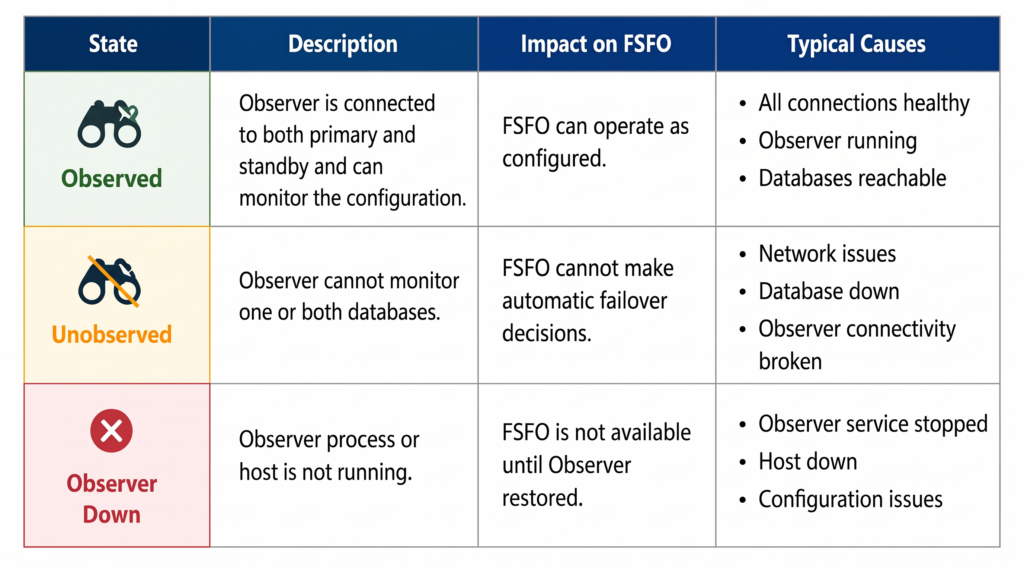
Figure 5: Observer States
This illustrates an important monitoring principle. A system can be running while an important relationship within the high-availability architecture is no longer intact.
The monitoring system should therefore be able to distinguish between:
- Component availability
- Connectivity
- Configuration status
- End-to-end operational readiness
For example:
- Observer host online does not necessarily mean Observer functioning correctly.
- Observer process running does not necessarily mean the required database relationships are healthy.
- Databases reachable does not necessarily mean the configuration is in the expected observed state.
Each level provides additional confidence.
Monitoring Switchovers and Failovers
Data Guard environments are dynamic. The database currently acting as primary may later become a standby following a planned switchover. An unplanned failover can also change the operational topology.
Monitoring must understand these transitions.
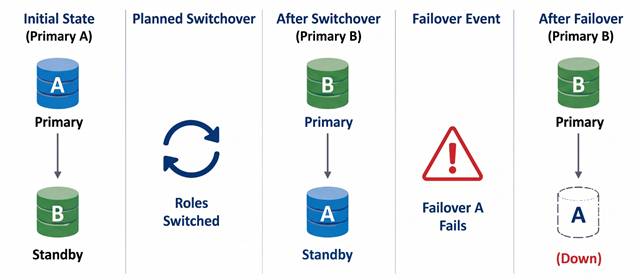
Figure 6: Role Transitions and Monitoring Awareness
A role change must not create a monitoring blind spotw
After a switchover:
- The former standby may become the primary.
- The former primary may become a standby.
- Monitoring relationships change.
- Synchronization direction changes.
The operational importance of each database changes.
If monitoring relies on static assumptions, role changes can create false alerts or, worse, leave the new primary insufficiently monitored.
A Data Guard-aware monitoring implementation should therefore discover and represent the actual current role rather than permanently associating critical monitoring with a fixed server name.
Monitor the transition, not just the final state
A successful role change should be validated.
Monitoring should help answer:
- Did the expected role change occur?
- Is the new primary healthy?
- Is the new standby healthy?
- Has redo transport resumed as expected?
- Has redo apply resumed as expected?
- Has the configuration returned to its expected state?
- Is synchronization recovering within the expected limits?
- Are Fast-Start Failover and Observer-related conditions still correct where applicable?
This is particularly important after planned maintenance.
A maintenance team may successfully complete a switchover, but the operational process is not complete until the monitoring environment confirms that the new topology is healthy.
From Technical Status to Actionable Alerts
Collecting Oracle Data Guard information is useful. Generating actionable operational information is more valuable.
A monitoring platform should help operations teams answer:
- What happened?
- How important is it?
- What is affected?
- Is this a root cause or a symptom?
- Who needs to act?
- What should they investigate first?
Microsoft SCOM provides an enterprise monitoring environment in which health states, alerts, workflows and operational processes can be combined.
The monitoring design should therefore avoid simply creating an alert for every piece of technical output.
Avoid alert storms
A single underlying issue can produce multiple symptoms.
For example, a connectivity issue may contribute to:
- Transport lag
- Apply lag
- Broker warnings
- Database communication errors
- Observer-related warnings
If every symptom generates an independent high-priority alert, operators may receive a flood of notifications. This can obscure the root cause.
A good monitoring design should consider dependencies and relationships so that operators can understand the broader health context.
Prioritize conditions according to impact
Not every deviation requires the same response.
For example:
Informational – A planned role change is detected.
Warning – Apply lag exceeds the normal threshold for a defined period.
Critical – The standby is unavailable or the Data Guard configuration reports a critical condition affecting protection.
The exact classification should reflect the organization’s operational model.
Provide meaningful alert descriptions
An actionable alert should contain enough context to begin investigation.
Useful information may include:
- Data Guard configuration
- Affected database
- Current role
- Current status
- Transport lag
- Apply lag
- Configured threshold
- Relevant Broker status
- Observer status where relevant
- Time of state change
This reduces the need for operators to manually assemble basic context from multiple consoles.
Using Microsoft SCOM for Data Guard-Aware Monitoring
Microsoft SCOM is often already used to monitor infrastructure, applications and Microsoft workloads. Extending it to Oracle environments can help organizations bring database availability into the same operational framework.
For Data Guard monitoring, the goal should be deeper than basic connectivity checks.
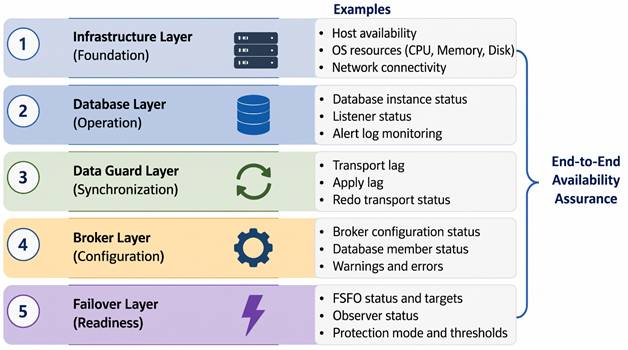
Figure 7: Data Guard Monitoring Layers
Monitor the technology, not just the server
A server-centric approach can answer: Is Server A online?
An Oracle-aware approach can answer: Is Oracle Database A operational?
A Data Guard-aware approach goes further: Is the complete protection relationship between the primary and standby databases operating as intended?
This progression is important. The higher the level of abstraction, the closer monitoring gets to the actual service and availability objective.
Represent health in context
SCOM health states can help represent whether a monitored object is
- Healthy
- Warning
- Critical
For Oracle Data Guard, specialized monitoring can apply these states to relevant configuration and database conditions. For example:
- Healthy: Primary and standby are operating as expected and lag is within defined limits.
- Warning: Lag exceeds an early-warning threshold or a non-critical configuration issue requires investigation.
- Critical: A condition threatens the availability or protection capability of the environment.
The precise logic should be aligned with the organization’s recovery requirements.
Use overrides to adapt monitoring to the environment
Oracle environments are rarely identical. A global threshold may not work for every workload.
SCOM overrides can support a more flexible model where the underlying monitoring logic is retained while selected parameters are adapted. Examples include:
- Different lag thresholds
- Different alert severity
- Different monitoring frequency
- Different behavior for test and production environments
- Different requirements for critical databases
This helps prevent a choice between two undesirable extremes: One global threshold that fits nobody, or A completely separate custom monitoring solution for every database.
Common Oracle Data Guard Monitoring Gaps
The following gaps occur when monitoring focuses too narrowly on component availability.
Monitoring only whether the databases are online
The problem: Both primary and standby databases are available, so the environment appears healthy.
What is missed: Synchronization may be degraded.
Better approach: Monitor transport lag, apply lag and configuration health.
Monitoring transport but not apply
The problem: Redo is successfully arriving at the standby.
What is missed: The standby may be unable to apply redo quickly enough.
Better approach: Monitor both transport and apply lag.
Using the same lag threshold everywhere
The problem: A generic threshold is applied to all databases.
What is missed: Different workloads have different recovery requirements.
Better approach: Align thresholds with business criticality and recovery objectives.
Treating Data Guard Broker as a management tool
The problem: Administrators inspect Broker status only when investigating an issue.
What is missed: Warnings and degradation may not be detected early.
Better approach: Continuously monitor relevant Broker configuration and member states.
Assuming that enabled FSFO means ready FSFO
The problem: Fast-Start Failover was configured successfully and is assumed to remain operational.
What is missed: Target, synchronization, Observer or other configuration-related conditions may change.
Better approach: Monitor the state of the Fast-Start Failover environment continuously.
Not monitoring the Observer
The problem: The Observer is outside normal database monitoring.
What is missed: An issue affecting the automatic failover environment.
Better approach: Monitor Observer status and, where appropriate, its underlying host and runtime environment independently.
Treating switchovers as one-time administrative events
The problem: The role change completes, and the work is considered finished.
What is missed: The new configuration may not return to the expected healthy and synchronized state.
Better approach: Validate the complete Data Guard configuration after every planned or unplanned role transition.
Best Practices for Oracle Data Guard Monitoring
The following practices provide a foundation for an effective monitoring strategy.
Monitor the configuration, not only individual databases
Understand the relationships between primary, standby, synchronization and failover components.
Monitor both transport and apply lag
Receiving redo and applying redo are different operational stages. Both matter.
Align thresholds with recovery requirements
Use business and technical requirements to define acceptable conditions. Avoid arbitrary universal thresholds.
Monitor trends, not only instantaneous values
Persistent or increasing lag often provides more useful information than a short-lived spike.
Monitor Data Guard Broker status continuously
Do not rely exclusively on manual DGMGRL checks during incidents. Bring relevant status changes into the operational monitoring environment.
Treat Fast-Start Failover as an operational service
Monitor its relevant configuration and readiness rather than assuming that initial configuration guarantees permanent readiness.
Monitor the Observer independently
The Observer can be a critical part of the Fast-Start Failover environment and should not remain outside the organization’s monitoring strategy.
Make monitoring role-aware
After switchovers and failovers, monitoring must understand the new primary and standby roles.
Reduce duplicate alerts
Use health relationships and alert design to help operators identify meaningful problems instead of being overwhelmed by symptoms.
Test monitoring against real operational scenarios
A monitoring design should be validated through realistic situations such as:
- Growing transport lag
- Growing apply lag
- Standby unavailability
- Broker warning conditions
- Observer problems
- Planned switchover
- Unplanned failover
Monitoring that has only been tested against a database shutdown may fail to identify more subtle but equally important Data Guard degradation.
How NiCE Extends Microsoft SCOM for Oracle Monitoring
Microsoft SCOM provides a powerful enterprise monitoring framework, but specialized technologies require specialized monitoring knowledge.
Oracle environments contain database-specific architecture, processes, performance indicators and availability mechanisms that are not fully addressed by generic server or process monitoring.
This is where purpose-built management packs can extend the value of SCOM.
NiCE IT Management Solutions specializes in extending Microsoft SCOM with deep monitoring for enterprise technologies. For Oracle environments, a specialized monitoring approach can bring Oracle-specific health information into SCOM and help organizations avoid building, maintaining and supporting extensive collections of custom scripts.
For Oracle Data Guard environments, the ideal monitoring model should provide visibility across the relevant layers of the configuration, including—subject to the capabilities and supported Oracle versions of the deployed NiCE Oracle Management Pack:
- Oracle database health
- Database role awareness
- Data Guard configuration status
- Primary and standby relationships
- Transport lag
- Apply lag
- Data Guard Broker status
- Fast-Start Failover-related status
- Observer-related monitoring where supported
- Health state integration
- Actionable SCOM alerts
- Threshold configuration and overrides
The objective is not to replace Oracle’s own Data Guard tools. Oracle Data Guard Broker and its associated commands remain important sources of authoritative configuration and status information.
The objective is to bring relevant operational insight into SCOM so that Oracle Data Guard can be monitored as part of the organization’s wider infrastructure and application monitoring strategy.
This can help teams answer a critical operational question from a central monitoring environment:
Is our Oracle Data Guard environment not only running, but healthy, synchronized and ready to support the availability objectives for which it was designed?
From Monitoring Components to Monitoring Readiness
The ultimate goal of Data Guard monitoring should be confidence.
Not confidence that every server is currently online. Not confidence that an Oracle service responds to a connection request. But confidence that the protection architecture remains capable of doing its job.
That requires visibility into multiple dimensions.
Availability
Are the required databases and infrastructure components operational?
Synchronization
Is the standby sufficiently current?
Configuration health
Does the Data Guard Broker report the expected state?
Failover readiness
Are the conditions supporting the organization’s failover strategy intact?
Observer readiness
Where Fast-Start Failover is used, is the Observer environment functioning as expected?
Operational awareness
Will the responsible teams know quickly when one of these conditions changes?
When these questions are monitored together, organizations gain a much more meaningful view of Oracle availability.
A green database icon alone cannot provide that assurance.
Conclusion
Oracle Data Guard provides a sophisticated foundation for database availability, data protection and disaster recovery. But the effectiveness of that foundation depends on more than whether the primary and standby databases are currently online.
Redo must be transported. Redo must be applied. The Data Guard configuration must remain healthy. The Broker must report the expected state. Fast-Start Failover, where used, must remain aligned with the organization’s recovery requirements. The Observer must not become an invisible point of operational uncertainty. Role changes must be recognized.
And, most importantly, the operations team must know when the environment begins to deviate from the state required to meet its availability objectives.
This is why specialized Data Guard monitoring matters.
Organizations should move beyond the question: Is the Oracle database running?
And instead ask: Is the complete Oracle Data Guard environment healthy, synchronized and ready to perform when we need it most?
Microsoft SCOM provides an enterprise monitoring platform for turning infrastructure and application status into operational insight. With specialized Oracle monitoring from NiCE IT Management Solutions, organizations can extend this approach into complex Oracle environments and bring Data Guard health, synchronization and availability considerations into their broader monitoring operations.
Because when a failover is required, discovering that a protection mechanism was degraded is already too late.
Continuous visibility is what turns high-availability architecture into operational readiness.
Contact us for advanced Oracle monitoring
We are looking forward to your inquiry.