Omnissa Horizon Monitoring on Microsoft SCOM
Omnissa Horizon is far more than a collection of virtual desktops. It is a complex service built on interconnected components, infrastructure, identity systems, applications, and user sessions — where issues in one area can quickly impact the entire user experience.
Traditional infrastructure monitoring alone often cannot answer the most important operational question: Can users actually access and use the services they depend on?
This paper explores what should be monitored in an Omnissa Horizon environment, the different monitoring approaches available, and how Microsoft SCOM can provide a unified operational view.

On a normal Monday morning at 08:15, users report that they cannot access their virtual desktops.
SCOM shows that all Horizon servers are healthy. Minutes later, the operations team discovers that one vSphere datastore has reached capacity, preventing new desktops from being provisioned.
What initially appeared to be a Horizon issue was, in fact, a virtualization problem. Service-aware monitoring would have correlated these events immediately.
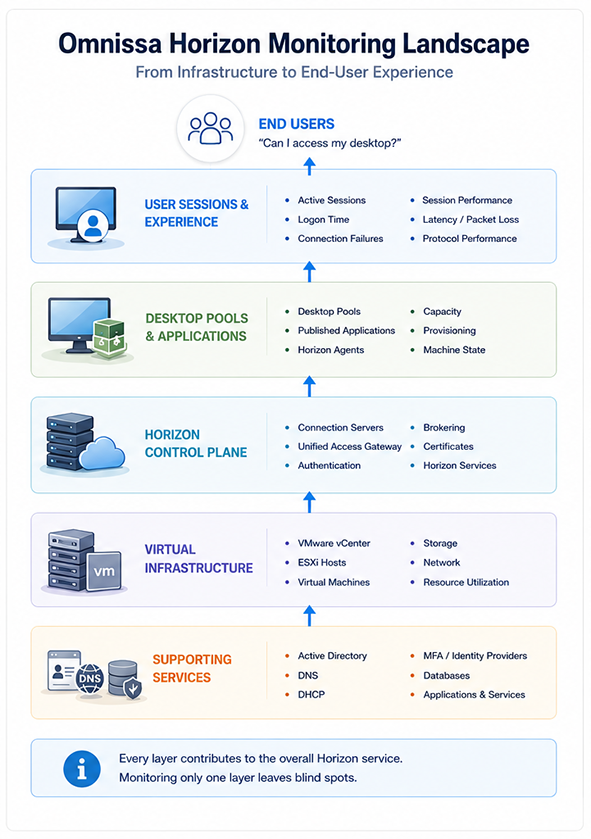
Virtual Desktop Environments
Virtual desktop environments are expected to be available, responsive, and predictable. Users should be able to authenticate, access their assigned desktops or applications, and work without being confronted with failed connections, long logon times, or unexplained performance issues.
An Omnissa Horizon environment is not a single application. It is an interconnected service made up of Horizon components, virtual machines, hypervisor infrastructure, identity services, networks, certificates, applications, and user sessions.
Monitoring only whether individual servers are online is therefore not enough.
A Connection Server can be running while users are unable to authenticate. A desktop pool can be available while no desktops are actually available for new connections. A virtual machine can be healthy from an operating system perspective while users experience severe session performance problems.
This whitepaper explores:
- Where custom monitoring and Management Pack development can add value
- What should be monitored in an Omnissa Horizon environment
- Why traditional infrastructure monitoring is not enough
- Which monitoring approaches can be combined
- How Microsoft SCOM can provide the operational framework
Monitoring a Service,
Not Just Its Components
At first glance, monitoring an Omnissa Horizon environment might seem straightforward. Check whether Connection Servers are running, Horizon services are available, desktop machines are powered on, virtual machines are healthy, and vCenter is accessible.
In addition, the environment may depend on Active Directory, DNS, DHCP, identity providers, multifactor authentication, load balancers, firewalls, storage, databases, application services, and network connectivity.
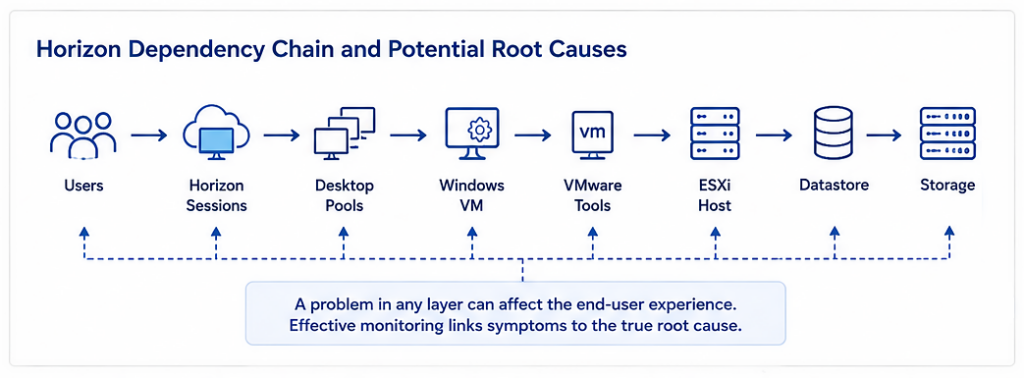
A problem anywhere in this chain can affect the end-user experience.
The monitoring challenge is therefore not simply: Is this server running?
It is: Can users successfully access the desktops and applications they need?
That distinction is at the heart of effective Horizon monitoring.
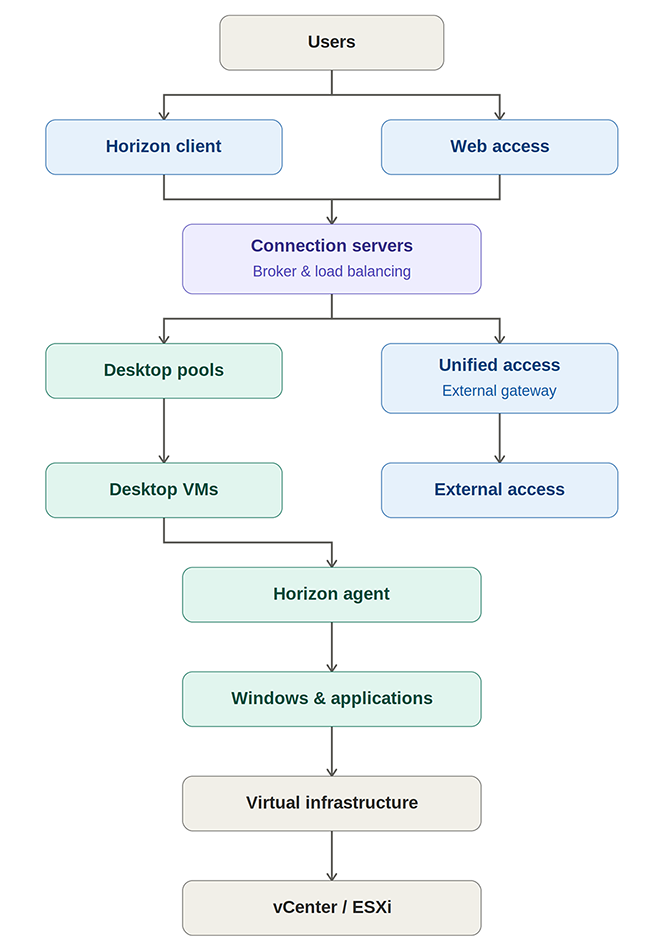

Why Generic Infrastructure Monitoring Is Not Enough
Most organizations already monitor the underlying infrastructure — whether a Windows server is online, whether CPU or disk utilization is high, whether a service has stopped, whether a VM is powered on, whether vCenter is available.
This information is valuable and necessary. However, it does not always provide the context required to understand the Horizon service.
These four examples demonstrate how important the difference between component monitoring and service monitoring can be.
Scenario 1: The Connection Server Is Online
The operating system is healthy, the Horizon service is running, and the server responds to network requests — yet users are experiencing authentication failures.
Traditional infrastructure monitoring may report: Everything is healthy. A Horizon-aware monitoring approach should be able to ask: Are users actually able to authenticate and establish sessions?
Scenario 2: A Desktop Pool Is Available
The pool exists and is configured. However, too few desktops are available, provisioning has failed, machines are stuck in an error state, or Horizon Agents are not registering correctly.
The pool may technically be present, but it cannot provide the service users require.
Scenario 3: A Virtual Machine Is Healthy
The guest operating system reports no critical problems. However, the user session has high latency, the network connection is unstable, the VM is under resource pressure, and the user experience is degraded.
The infrastructure is technically available, but the service is not performing as expected.
Scenario 4: A Certificate Is Approaching Expiration
The Horizon environment is currently operating normally. However, a certificate used by a critical component is approaching expiration. Proactive monitoring can provide advance warning, defined thresholds, notifications, and clear operational ownership — transforming a potentially disruptive incident into a planned maintenance activity.
The Horizon Monitoring Stack
Every monitoring layer answers different operational questions. No single monitoring technique covers the complete service.
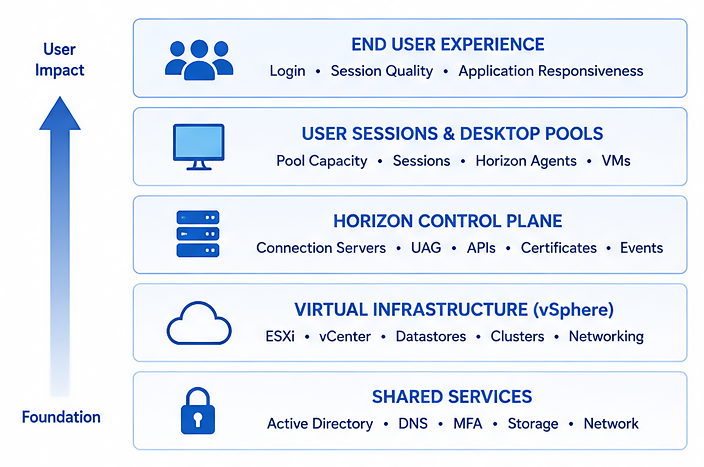

A Layered Monitoring Approach
No single monitoring technology can provide complete visibility into an Omnissa Horizon environment.
A user login depends on multiple technology layers — from authentication and networking through virtual infrastructure to the Horizon control plane and finally the user session itself.
An effective monitoring strategy therefore combines infrastructure monitoring with Horizon-specific monitoring, dependency awareness, and user experience monitoring. Each layer answers different operational questions and contributes to understanding the health of the overall service.
The following sections explain each layer in more detail.
What to Monitor at Each Layer
The following layers build on one another, from the control plane through to the end-user session.
The objective is to move from “the desktop is online” to “the user session is working as expected.“
Horizon Control Plane
Connection Servers and related Horizon services manage and broker access to desktops and applications. A combination of infrastructure monitoring, API-based monitoring, event collection, and synthetic checks may be appropriate here, covering:
- Availability — server, service and component health, process status, inter-component communication
- Capacity — CPU/memory utilization, resource consumption, capacity thresholds
- Authentication and brokering — success/failure rates, connection requests and failures
- Synchronization and configuration — replication health, configuration consistency, service relationships
- Certificates — validity, expiration dates, chain problems
- Events and logs — authentication and connection failures, configuration problems, service errors
Access and Connectivity
Users may access Horizon from inside or outside the corporate network, introducing Unified Access Gateway and related access services as a critical part of the user journey.
No single method is necessarily sufficient: HTTPS monitoring confirms an endpoint responds, API monitoring provides deeper application-specific information, synthetic monitoring simulates the full journey from authentication to session establishment, and log monitoring identifies failed connections and recurring errors.
Key areas include appliance availability, network and authentication connectivity, backend communication, certificate validity, external accessibility, protocol connectivity, session establishment, and service errors.
Desktop Pools and Capacity
From an operational perspective, one of the most important questions is: Can the environment provide a desktop to the next user who needs one?
A pool may exist and appear healthy while still being unable to satisfy user demand — for example, when the number of available desktops has fallen below the operational threshold, or provisioning failures are preventing the pool from maintaining sufficient capacity.
Relevant metrics include pool and desktop availability, connected and disconnected session counts, machines in error states, provisioning status, machine assignment, and capacity thresholds. This is more meaningful than simply monitoring whether the underlying virtual machines are powered on.
Horizon Agents and Desktop Machines
The Horizon Agent links the desktop operating system to the Horizon environment, helping identify whether desktops are not merely running, but actually available for Horizon users — covering agent availability, registration, communication, version, connection to Horizon infrastructure, desktop state, and communication failures. The operating system itself can also be monitored using established SCOM capabilities: CPU, memory, disk space and performance, Windows services, processes, event logs, network connectivity, and OS health.
The key value of Horizon-specific monitoring is the ability to add context. “A Windows desktop has high CPU utilization” is an infrastructure observation. “Multiple desktops in Horizon Pool A are experiencing high CPU utilization, resulting in degraded capacity and potential user impact” is an operationally relevant service observation.
User Sessions
The user session is where the technical infrastructure becomes a service. A user may authenticate successfully, but still experience failed desktop connections, long connection times, disconnections, high latency, poor responsiveness, or application launch problems.
Depending on available data sources, session monitoring may draw on Horizon APIs and events, agent-side data, Windows performance data, network monitoring, and synthetic transactions — covering active, disconnected, and failed sessions, session duration, connection and logon failures, protocol usage, session latency, network performance, and user assignments.
Infrastructure vs Service Monitoring
Service-aware monitoring connects components, dependencies, performance, and events to determine the true user impact.
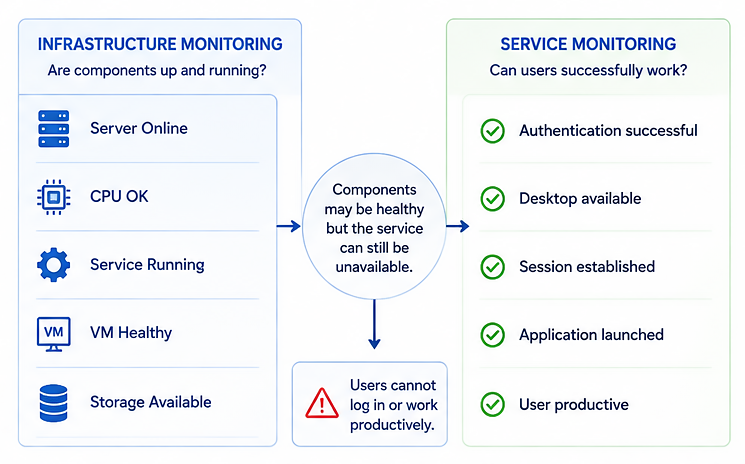

Infrastructure Health Does Not Equal Service Health
Traditional monitoring answers whether technical components are available.
Service monitoring answers whether the business service is actually usable.
For Horizon environments, both perspectives are required. Infrastructure monitoring identifies failing components, while service monitoring determines whether those failures affect users.
The combination dramatically reduces the time required to identify the true root cause of an incident.
From Infrastructure Monitoring to User Experience Monitoring
Monitoring the environment and monitoring the experience are related, but they are not identical. A user experience problem may be caused by a virtual machine, a host, storage, a network, authentication, a Connection Server, a protocol issue, an application, or a configuration problem — which is why isolated alerts can be difficult to interpret.
A monitoring solution that understands these relationships can provide more meaningful information than a series of unrelated alerts. The goal is not necessarily to eliminate all alerts, but to provide the context so operations teams can identify what is failing, who is affected, which service is impacted, the likely cause, and what should happen next.
Monitoring the Dependencies
Horizon does not operate in isolation. The user experience may depend on a broad range of supporting services.
Identity and Authentication
Active Directory, LDAP, DNS, multifactor authentication, federation services, and identity providers. A failure in authentication may prevent users from reaching Horizon even when Horizon itself is operating normally.
Virtual Infrastructure
vCenter, ESXi hosts, clusters, datastores, virtual machines, and storage systems — monitored for availability, capacity, performance, resource contention, and connectivity.
Network Infrastructure
Firewalls, load balancers, DNS, DHCP, network paths, and WAN connectivity. A Horizon environment may be technically healthy while a network problem prevents users from reaching it.
Certificates
Certificates affect Connection Servers, Unified Access Gateway, load balancers, authentication services, and external access. Certificate expiration is a classic example of a problem that can be prevented through proactive monitoring.
Applications and Backend Services
Published applications may depend on application servers, databases, file services, APIs, and backend services. Monitoring Horizon without understanding critical application dependencies may provide only a partial view of the service.
Why vSphere Monitoring Matters
Horizon Starts with vSphere
Every virtual desktop ultimately runs on VMware vSphere.
Even if Horizon itself is functioning correctly, users may still experience poor performance because of resource contention, storage latency, host failures, networking issues, or cluster capacity problems.
Without visibility into the underlying virtualization platform, Horizon monitoring remains incomplete.
For this reason, Horizon monitoring should always be complemented by comprehensive VMware monitoring.

Potential Root Causes
- CPU Ready
- Storage Latency
- Snapshot Growth
- DRS imbalance
- Host Memory Pressure
- Datastore Full
- Network Congestion
Different Ways to Monitor Omnissa Horizon
There is no single monitoring method that provides every type of information.
Different techniques answer different questions. A mature monitoring strategy may combine several approaches.
Infrastructure-Based Monitoring
Uses traditional methods to monitor Windows servers, VMs, services, processes, operating systems, and network components. Strengths: familiar to operations teams, often already available, easy to integrate, broad visibility. Limitations: limited Horizon-specific context; may not understand desktop pools, user sessions, or whether users can actually connect. It is an important foundation, not a complete Horizon monitoring solution.
API-Based Monitoring
Provides Horizon-specific information — components, pools, machines, sessions, assignments, capacity, connection states, configuration — that is difficult to obtain through infrastructure monitoring alone. Strengths: Horizon-specific data, centralized access, useful for discovery and topology. Considerations: API availability, authentication, version compatibility, data scope, and polling performance.
Event and Log Monitoring
Logs and events provide insight into problems that are difficult to detect through simple availability checks — authentication and connection failures, provisioning errors, service failures, configuration changes, and repeated error conditions. Particularly useful for detecting why something is failing, not just that it has failed.
Performance Monitoring
Applied across Windows, Horizon Agents, virtual machines, hypervisors, storage, and networks to identify CPU/memory pressure, disk latency, network congestion, resource contention, and performance degradation. The challenge is connecting this data to the Horizon service: a high CPU value becomes far more meaningful when related to a specific desktop pool, a group of affected sessions, or a user-impacting condition.
Synthetic Monitoring
Simulates a user journey — authenticate, connect to Horizon, select desktop, establish session, launch application, measure result — to answer a question infrastructure monitoring cannot: Can a user actually complete the process of accessing the Horizon service? Particularly useful for external access, critical business services, authentication paths, published applications, and key desktop pools.
Designing Horizon Monitoring for SCOM
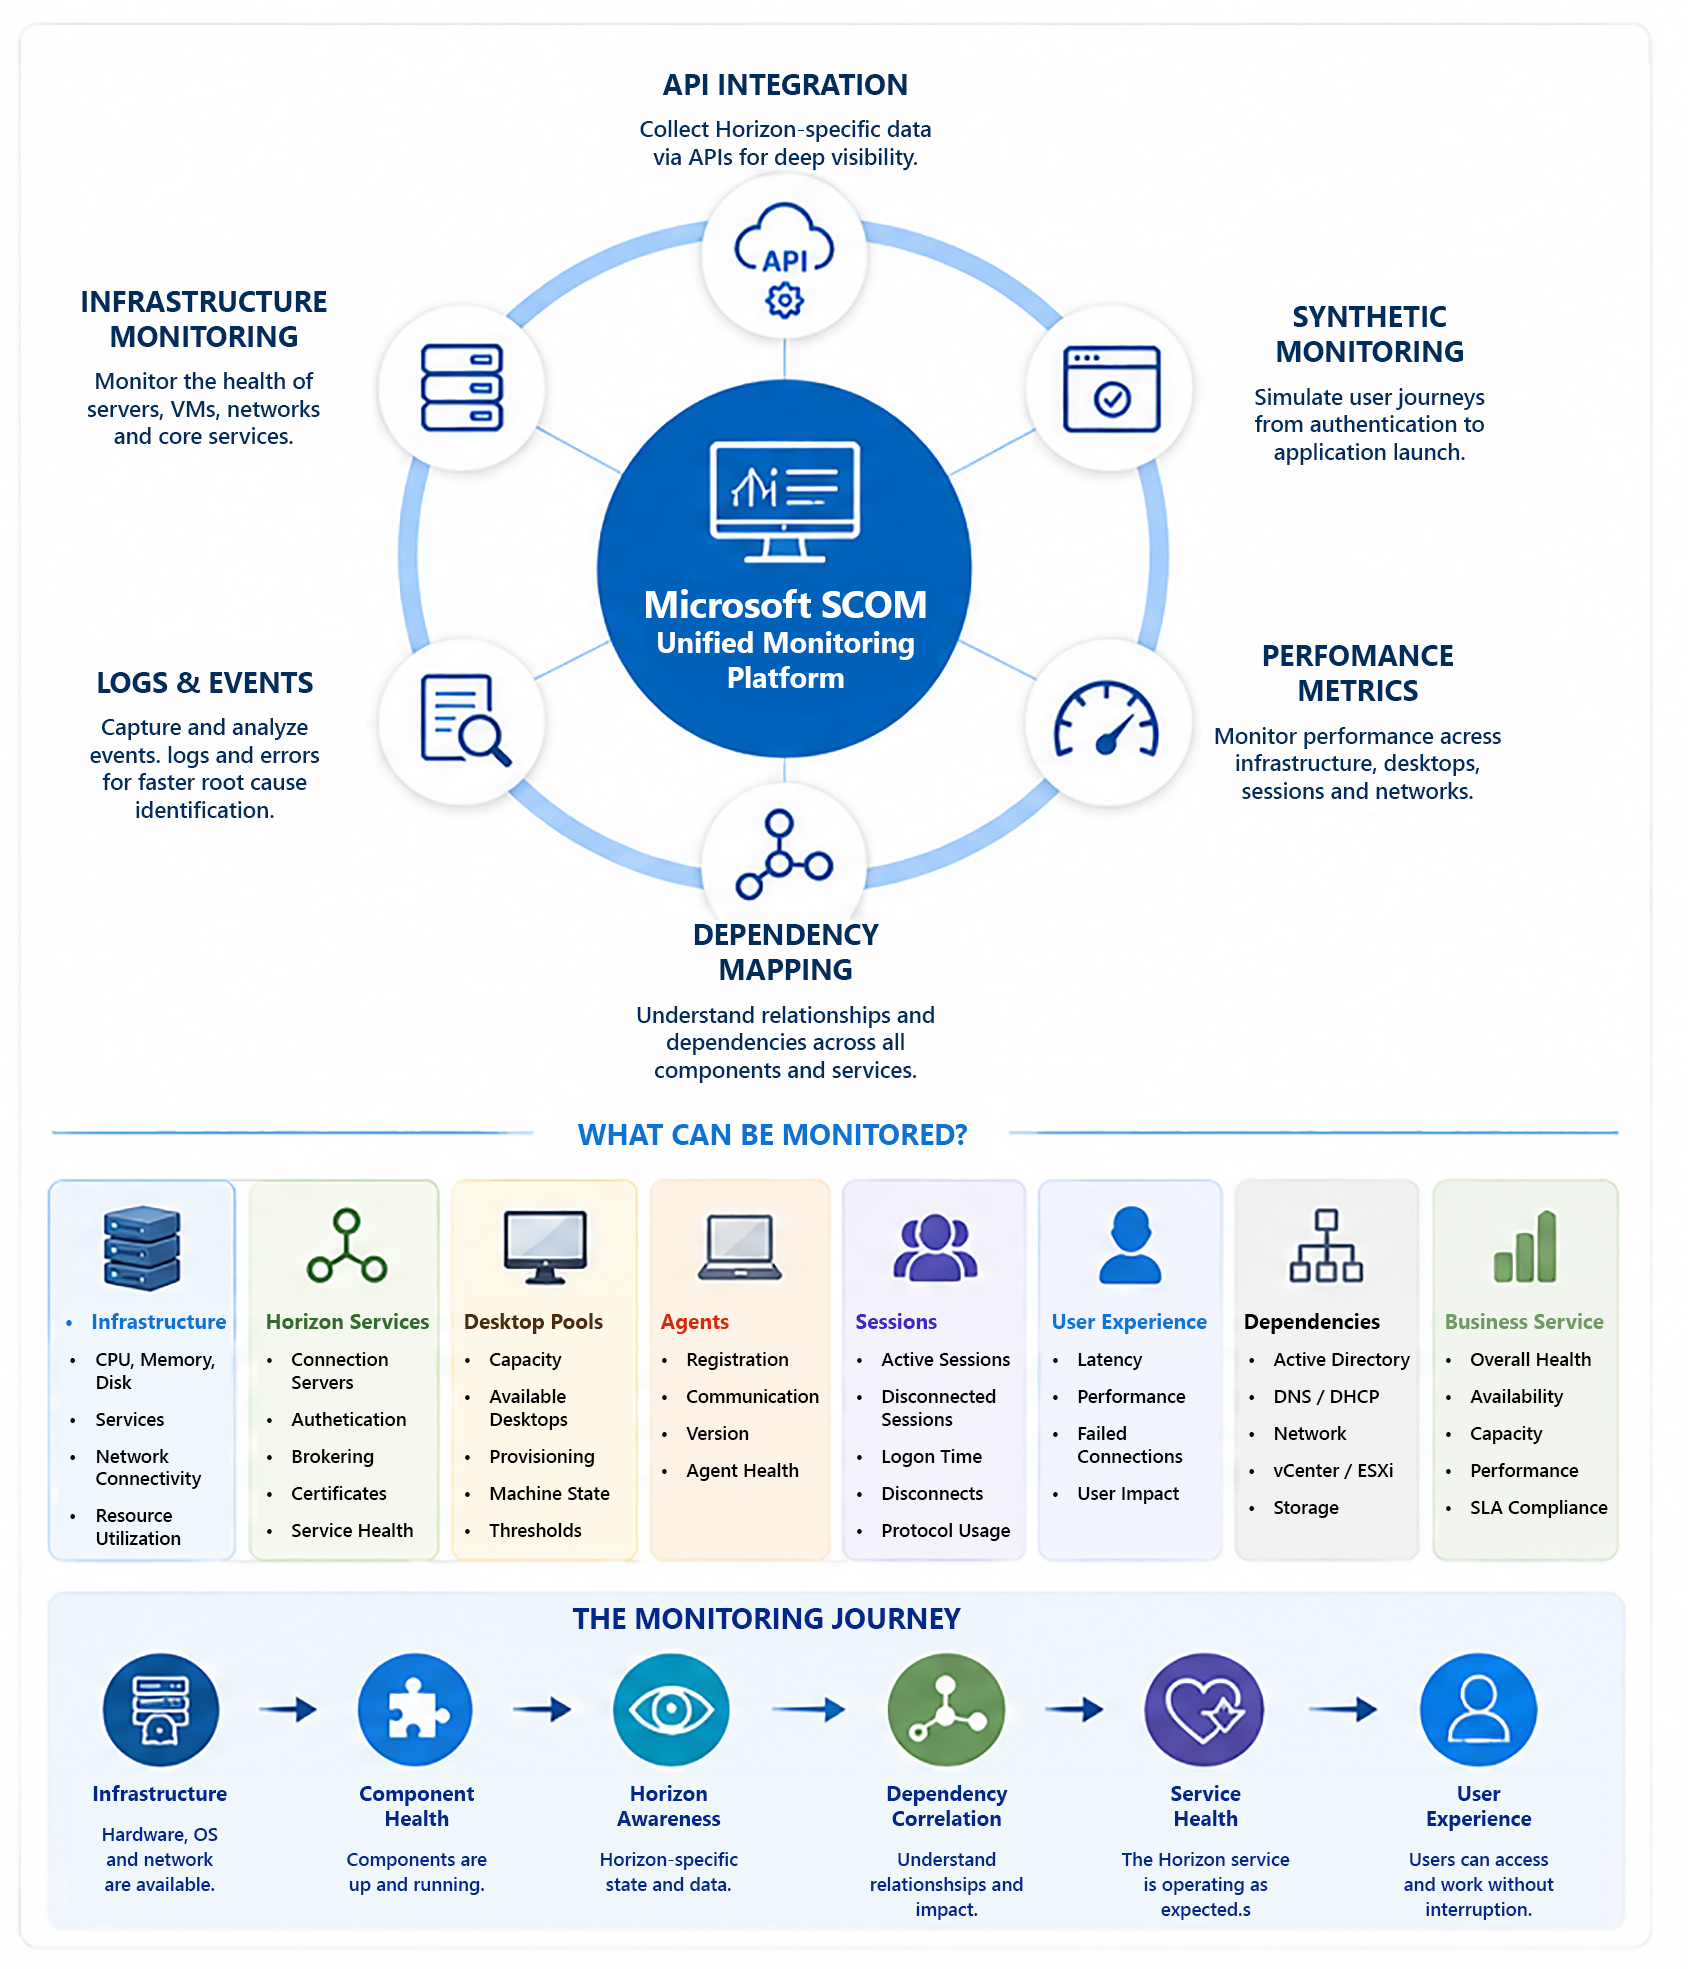
The monitoring concepts described in this paper are not provided by a standard off-the-shelf Management Pack.
Every Horizon implementation differs in architecture, authentication, desktop pools, operational processes, and monitoring objectives.
NiCE therefore designs and implements Horizon monitoring solutions as consulting projects and custom Management Pack extensions tailored to each customer’s environment.
- Discovery of Horizon-specific components and relationships
- State monitoring of Connection Servers, pools, machines, agents, sessions, and access services
- Performance collection and analysis
- Event monitoring of Horizon-related events and logs
- API integration for data not available through standard infrastructure monitoring
- Dependency modeling connecting Horizon to virtual infrastructure, identity, network, and applications
- Alerting based on meaningful Horizon conditions
- Dashboards for overall health, pool capacity, session activity, component availability, and user impact
- Reporting to support trend analysis and operations
The exact capabilities should be designed around the requirements of the Horizon ecosystem.
From Component Monitoring to Service Monitoring
Traditional monitoring often produces a list of individual component states: Connection Server — Healthy; vCenter — Healthy; Virtual Machine — Healthy; Active Directory — Healthy; Network — Healthy. This is useful, but it does not necessarily explain the overall service.
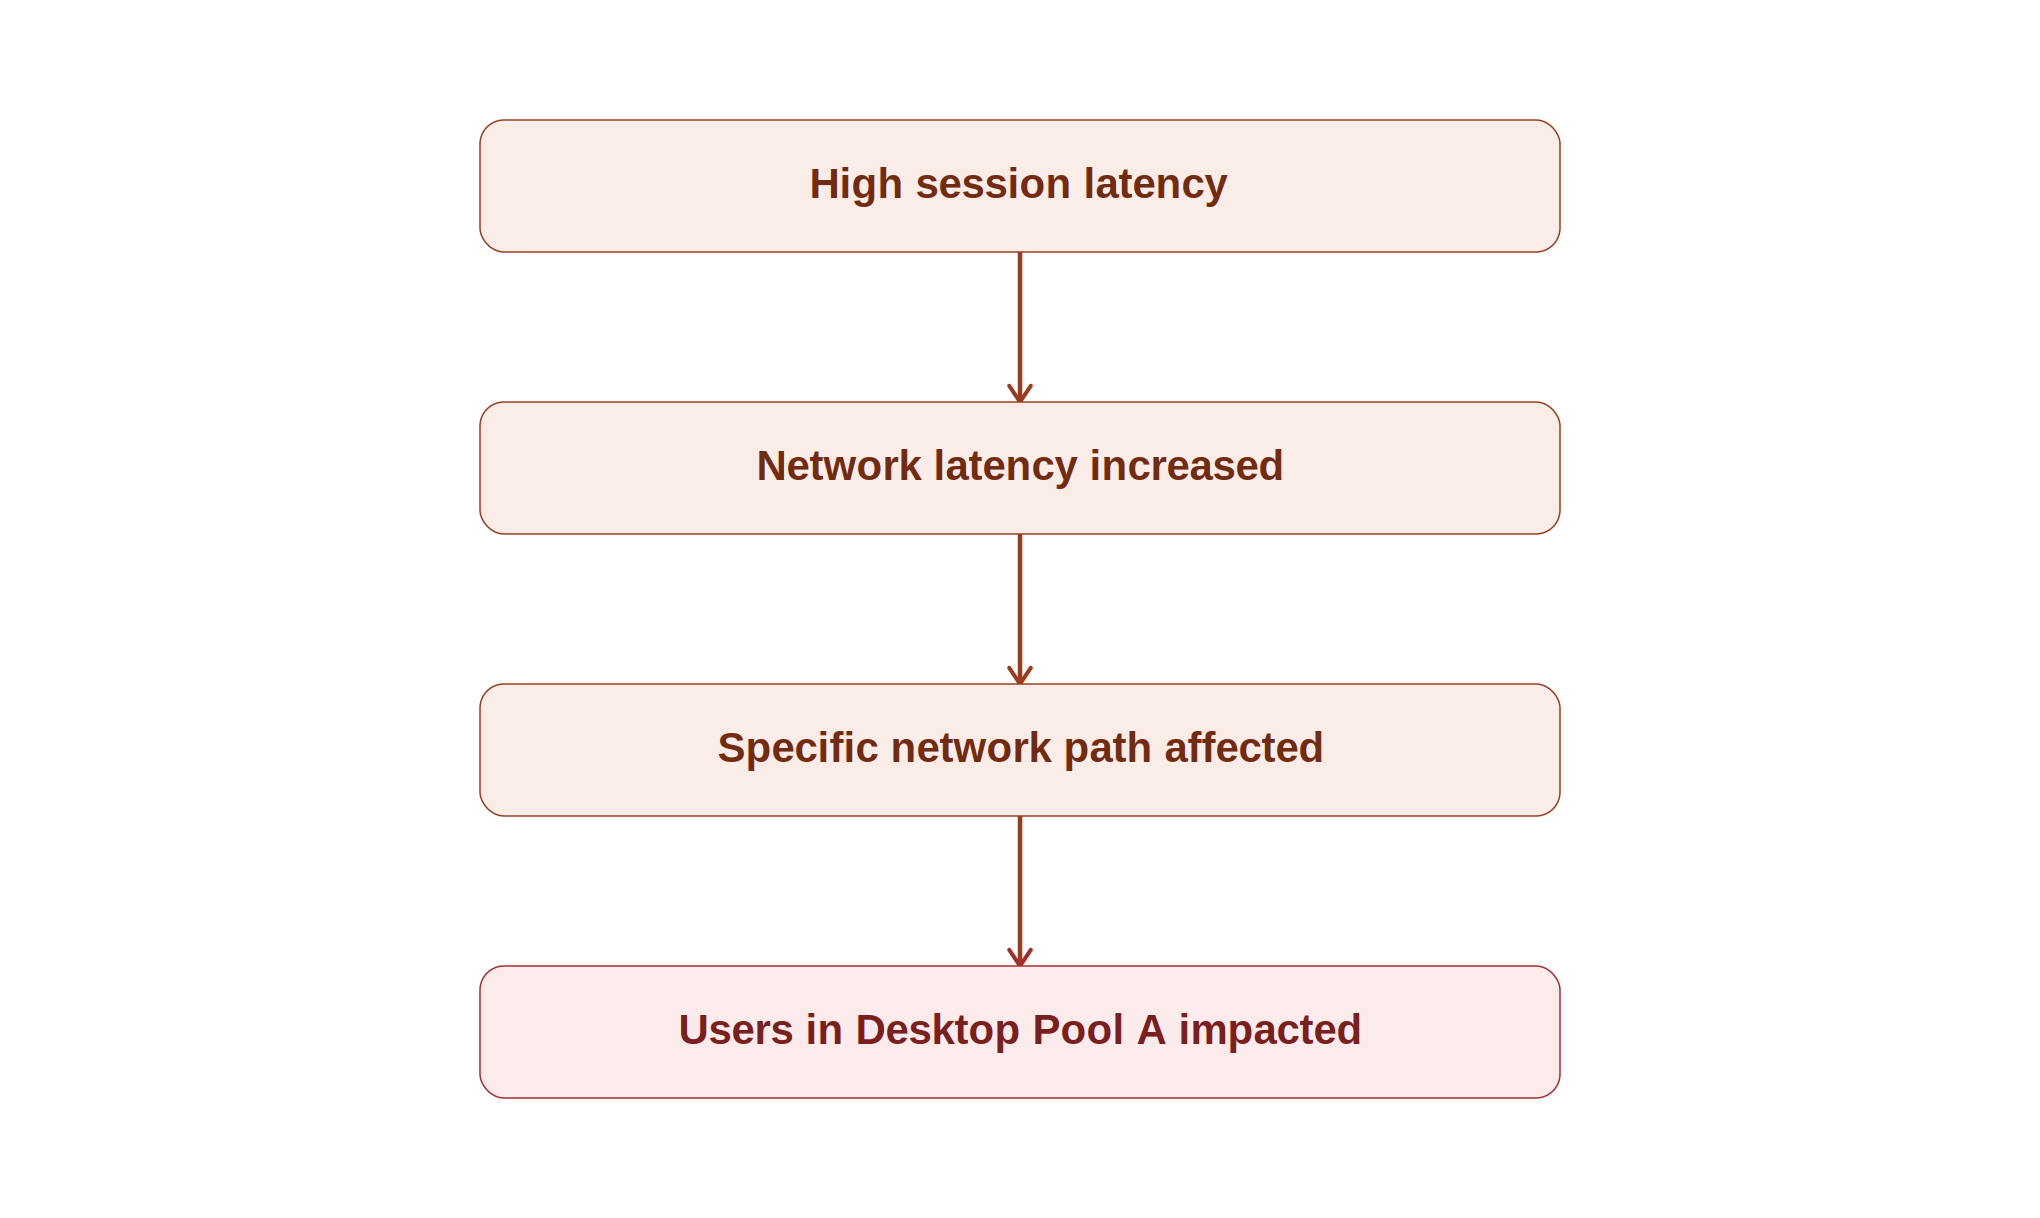
A service-oriented model might instead present: Horizon Desktop Service — Status: DEGRADED.
Potential cause: Authentication response times increased.
Impact: Users in Desktop Pool A experiencing increased logon times.
The difference is context.
Service-oriented monitoring connects components, dependencies, performance, events, and user impact — moving the solution beyond individual alerts.
Why Custom Monitoring Makes Sense
Every Horizon environment differs — in architecture, number of pods and users, desktop pools, access requirements, authentication architecture, monitoring objectives, existing SCOM configuration, and operational processes. A standard monitoring approach may therefore provide only part of the required visibility.
Custom Management Pack development can tailor monitoring to focus on:
- Availability — Are the required Horizon components available?
- Capacity — Can the environment provide sufficient desktops and applications?
- Performance — Are sessions and infrastructure operating within acceptable limits?
- User Experience — Can users connect and work successfully?
- Dependencies — Which supporting service is affecting Horizon?
- Prevention — Can capacity shortages or certificate expiration be caught before users are affected?
Operational Benefits
Organizations implementing service-aware Horizon monitoring typically aim to:
- Reduce Mean Time to Resolution (MTTR)
- Detect capacity bottlenecks before users are affected
- Correlate Horizon issues with underlying vSphere events
- Reduce alert noise through dependency awareness
- Accelerate root-cause analysis
- Improve SLA compliance
- Increase confidence during upgrades and maintenance
Designing the Right Monitoring Strategy
A successful Horizon monitoring solution should begin with operational questions: Can users access the Horizon service? Can the environment provide sufficient desktops and applications? Are users experiencing degraded sessions? Which supporting component is affecting the service? Which conditions could become an incident if left unaddressed? Can the monitoring team identify the likely cause and impact quickly?
These questions should determine what data needs to be collected, which monitoring methods should be used, which components should be modeled, which thresholds are appropriate, which alerts should be generated, and which dashboards and reports are required.
The goal should not be to collect every possible metric. The goal should be to collect the information needed to operate the service effectively.
Our Typical Engagement
Every Omnissa Horizon deployment has unique operational requirements.
Rather than delivering a generic Management Pack, NiCE works with your team to design a monitoring solution that reflects your Horizon architecture, operational processes, and business priorities.
Our structured engagement ensures the resulting monitoring solution integrates seamlessly into Microsoft SCOM while providing meaningful operational visibility from infrastructure to end-user experience.
- Discovery Workshop
- Monitoring Requirements
- Architecture Review
- Proof of Concept
- Custom Management Pack Development
- Pilot Deployment
- Production Rollout
- Knowledge Transfer
Conclusion
Omnissa Horizon monitoring is about more than determining whether a server is online. A complete Horizon service depends on a chain of interconnected components: access services, Connection Servers, desktop pools, Horizon Agents, virtual machines, virtual infrastructure, identity services, networks, applications, and user sessions.
Monitoring any one of these components in isolation may provide useful information. However, understanding the relationships between them provides significantly more operational value. The most effective monitoring strategies combine infrastructure monitoring, API-based monitoring, event and log monitoring, performance monitoring, synthetic monitoring, and service and dependency modeling.
With the right Horizon-specific extensions and monitoring design, organizations can move beyond a simple collection of component alerts and gain a clearer view of the service users actually depend on — answering: Is Horizon available? Can users access their desktops and applications? Is the environment able to meet demand? Are users experiencing performance problems? What is the likely cause of a service issue? Which components and users are affected?
Whether you’re extending an existing SCOM deployment or designing Horizon monitoring from the ground up, NiCE helps translate operational requirements into a monitoring solution that delivers meaningful service visibility — not just infrastructure metrics.
Monitor more than availability. Understand the service.
Reach out for more